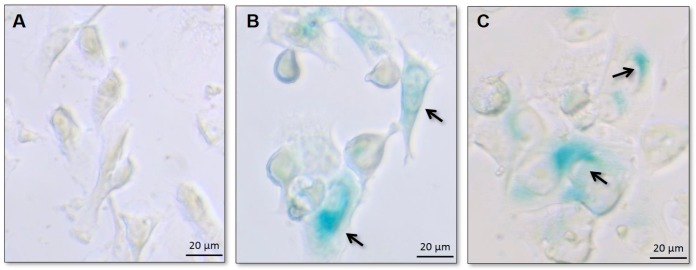
Figure 4.
Bright field photomicrographs of MDA-MB-231 cell line of the control group (A) or after treatments with PTX (B) and DXR (C) at a concentration of 70 nM for 48 h. On treated groups, cells are larger and were positively stained for SA-β-gal as indicated by arrows, confirming the occurrence of senescence. Amplification 40×.

