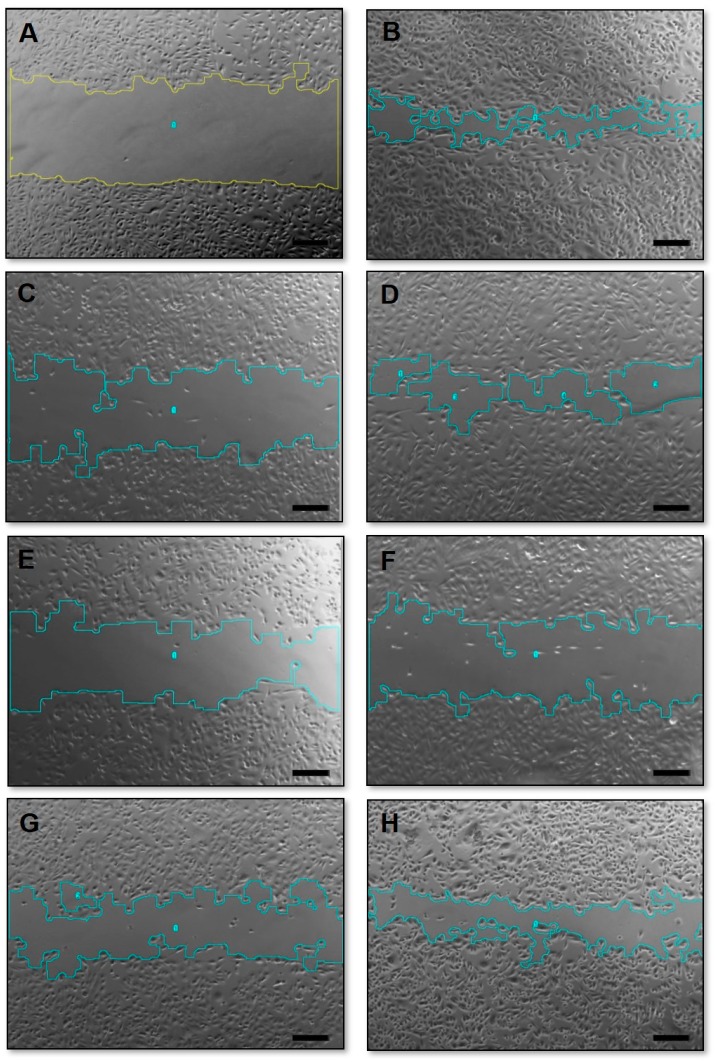
Figure 7.
Phase-contrast photomicrographs of the “zero wound” (A) and wounds of MDA-MB-231 cell line on control group (B); exposed for 24 h to 70 nM of PTX (C); DXR (D); PTX:DXR combinations at 10:1 (E); 1:1 (F); or 1:10 (G) molar ratios and to 6.4 nM of PTX (H). Amplification 5×, scale bar = 200 μm.

