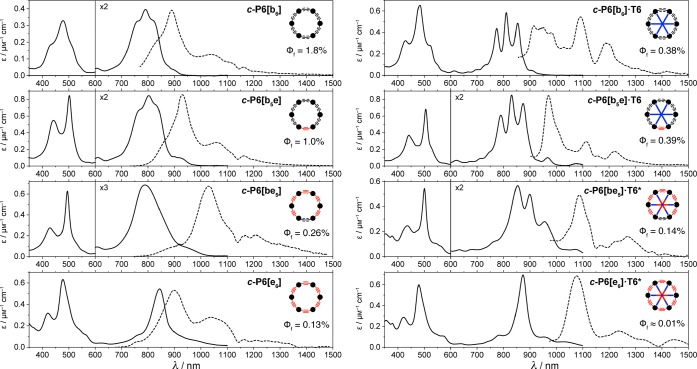
Figure 6.
Absorption (black lines) and fluorescence (dashed lines) spectra at 298 K of (left) c-P6[b6], c-P6[b5e], c-P6[be5], c-P6[e6] in toluene containing 1% pyridine and (right) c-P6[b6]·T6, c-P6[b5e]·T6, c-P6[be5]·T6*, and c-P6[e6]·T6* in toluene. Fluorescence quantum yields (Φf) are given in %. The dip in the fluorescence spectra at around 1140 nm is due to absorption by the solvent.

