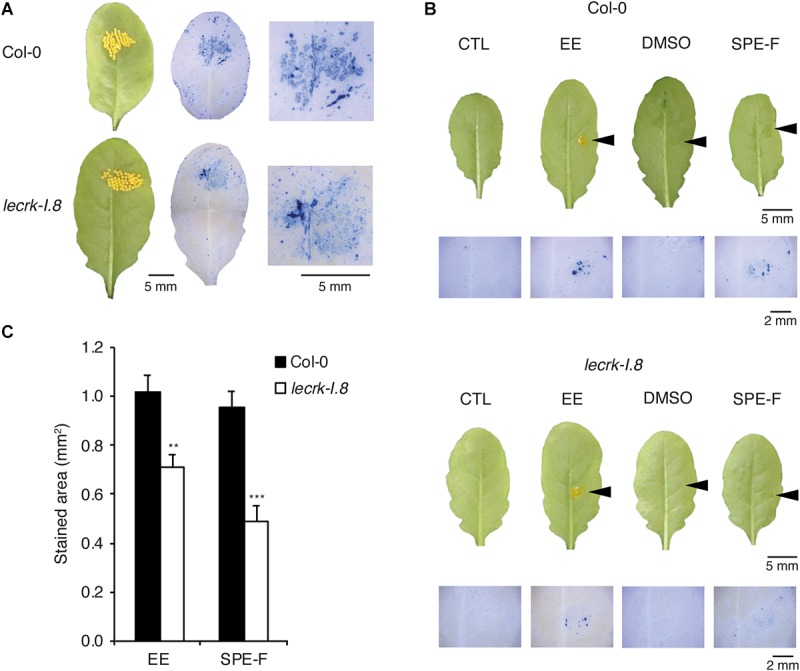
FIGURE 3.

Induction of cell death in response to natural oviposition, EE, and purified egg lipids. (A) Trypan blue staining to detect cell death was performed on P. brassicae oviposited Col-0 and lecrk-I.8 plants. Butterflies were allowed to lay eggs for 2 h on the plants and trypan blue staining was performed 72 h later. Representative leaves before and after staining and close-up images of the oviposited sites are shown. (B) Leaves from Col-0 and lecrk-I.8 were treated with 2 μl of P. brassicae EE, or with 2 μl of a 5 μg/μl solution of a solid phase extraction fraction of total egg lipids eluted with 100% MeOH (SPE-F). Untreated plants (CTL) and plants treated with 1% DMSO served as controls. Arrowheads indicate the site of treatment. Cell death was visualized 72 h after treatments by trypan blue staining. Panels are close-up images of the treated area. (C) Quantification of cell death in Col-0 and lecrk-I.8 in response to EE and SPE-F as in (B). Stained area was measured on images with ImageJ software (n = 12). Means ± SE are shown. Significant difference between wild-type and mutant are indicated (Student’s t-test, ∗∗P < 0.01, ∗∗∗P < 0.001).
