FIGURE 6.
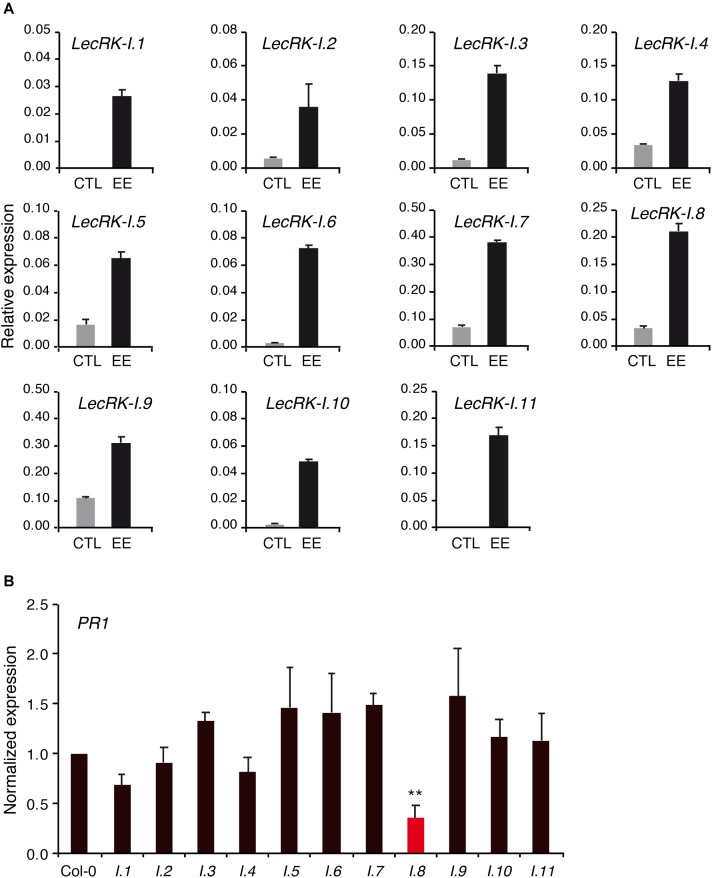
Role of LecRK-I.8 homologs. (A) Expression of LecRK-I.8 homologs 72 h after application of P. brassicae EE (black bars). Untreated plants were used as control (gray bars). Means ± SE of three technical replicates are shown. This experiment was repeated twice with similar results (B) PR1 expression in lecrk mutants 72 h after application of P. brassicae EE. Values were normalized to Col-0. Means ± SE of three independent biological replicates are shown. Significant difference between Col-0 and each mutant is indicated (Student’s t-test, ∗∗P < 0.01).

