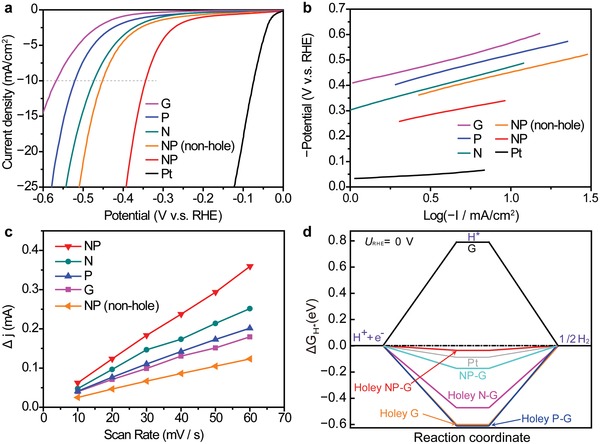
Figure 3.

HER activities of chemically doped graphene with edge structures. a) Hydrodynamic voltammograms of graphene samples with and without edges in 0.5 m aqueous H2SO4 electrolyte. b) Tafel plots of the various graphene samples. c) Differences in current (ΔJ =J a − J c) at 150 mV (V vs RHE) as functions of scan rate. d) Gibbs free energy profiles calculated by DFT.
