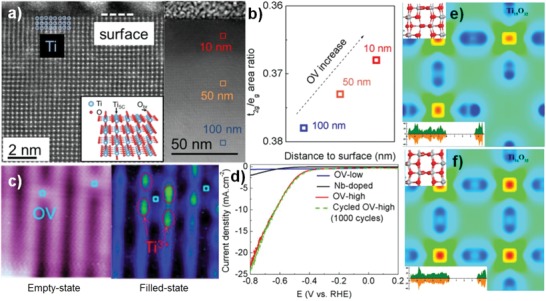
Figure 6.

a) Cross‐sectional scanning transmission electron microscopy (STEM) and large‐region cross‐sectional STEM image of reduced TiO2(110) single crystal in HAADF mode. b) OV concentration from the inner bulk region to the surface region. c) STM image of the reduced TiO2 surface with two individual OVs in the empty state (1.2 V, 20 pA) and Ti3+ ions in the filled state (−2.3 V, 10 pA). d) Linear sweep voltammetric (LSV) data on different electrocatalysts for the HER at the rate of 10 mV s−1. Reproduced with permission.59 Copyright 2018, American Chemical Society. e,f) Charge density difference of Ti‐defected and normal TiO2. Reproduced with permission.7 Copyright 2015, American Chemical Society.
