
Figure 2.
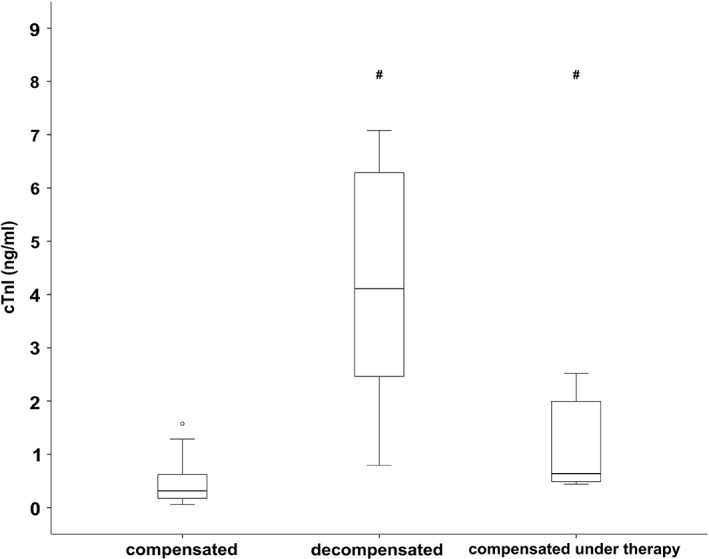
Serum cardiac troponin I concentration of cats with severe HCM that were either compensated (n = 15), acutely decompensated (n = 11), or compensated under treatment (n = 8). The middle line of each box stands for the median, whereas the upper line and lower line represent the 75th and 25th percentiles, respectively. Mild outliners (1.5‐3 times the IQR) are marked with a circle (°), whereas marked outlines (>3 times the IQR) are marked with an asterisk (*). The median cTnI concentration was significantly lower in the compensated group compared to the 2 other groups
# P < .05, if compared to the compensated severe HCM group. Post hoc analysis according to Conover.32
HCM, hypertrophic cardiomyopathy; cTnI, cardiac troponin I