
Figure 3.
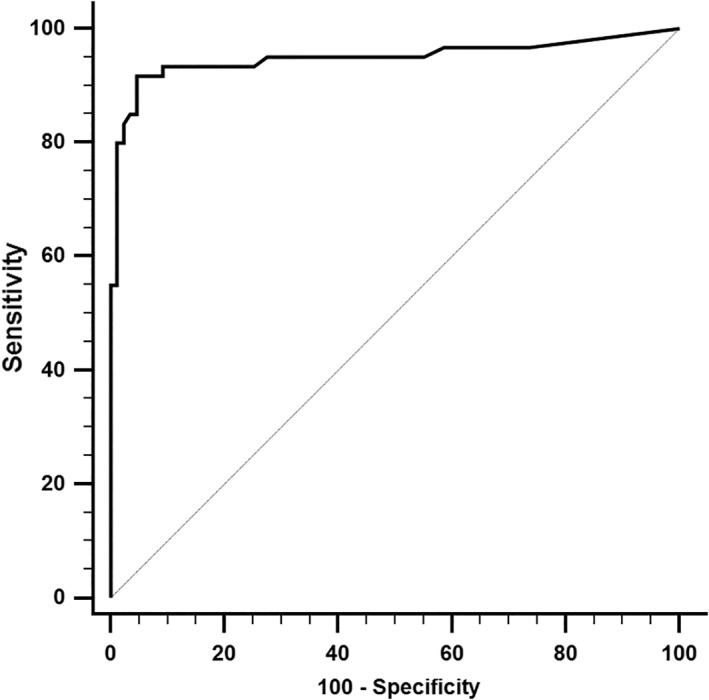
Receiver‐operating characteristic (ROC) curve displaying the sensitivity and specificity of serum cardiac troponin I concentration (cTnI) distinguishing healthy cats from cats with hypertrophic cardiomyopathy of different disease severity. The area under the curve is 0.95