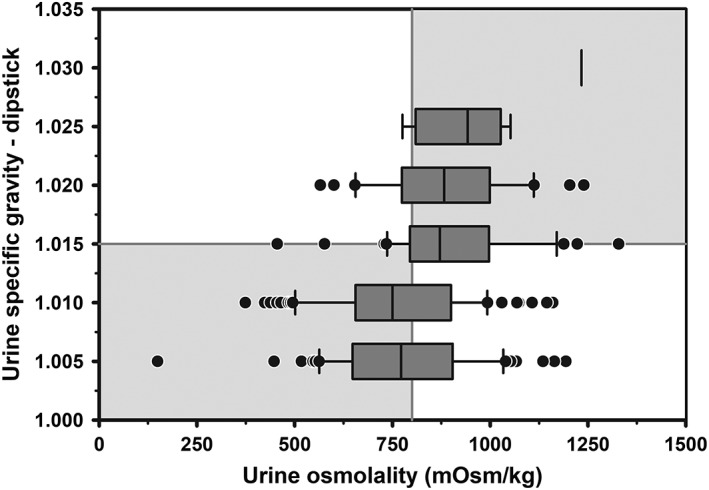
Figure 3.

Box and whiskers plot of the association between corrected urine specific gravity measured by urine dipstick (USG‐D) and urine osmolality (UOsm, reference method) for 241 urine samples obtained periodically from 20 multiparous periparturient Holstein‐Friesian cows. The solid gray vertical line indicates the recommended cut point for UOsm (≥800 mOsm/kg) for diagnosing hypohydration, and the solid gray horizontal line indicates the optimal cut point for corrected USG‐D (≥1.015) identified by logistic regression for diagnosing hypohydration. The box and whiskers plot represents the median (middle line), interquartile range (ends of the shaded rectangle), 10% to 90% confidence interval (whiskers), and values outside this confidence interval (small gray circles)
