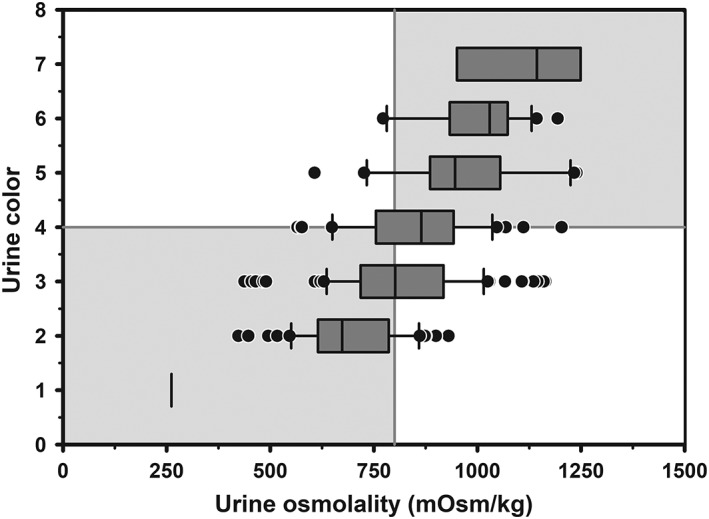
Figure 5.

Box and whiskers plot of the association between urine color (8 levels) and urine osmolality (UOsm; reference method) for 237 urine samples obtained periodically from 20 multiparous periparturient Holstein‐Friesian cows. The solid gray vertical line indicates the recommended cut point for UOsm (≥800 mOsm/kg) for diagnosing hypohydration, and the solid gray horizontal line indicates the optimal cut point for color (≥4) identified by logistic regression for diagnosing hypohydration. The box and whiskers plot represents the median (middle line), interquartile range (ends of the shaded rectangle), 10% to 90% confidence interval (whiskers), and values outside this confidence interval (small gray circles)
