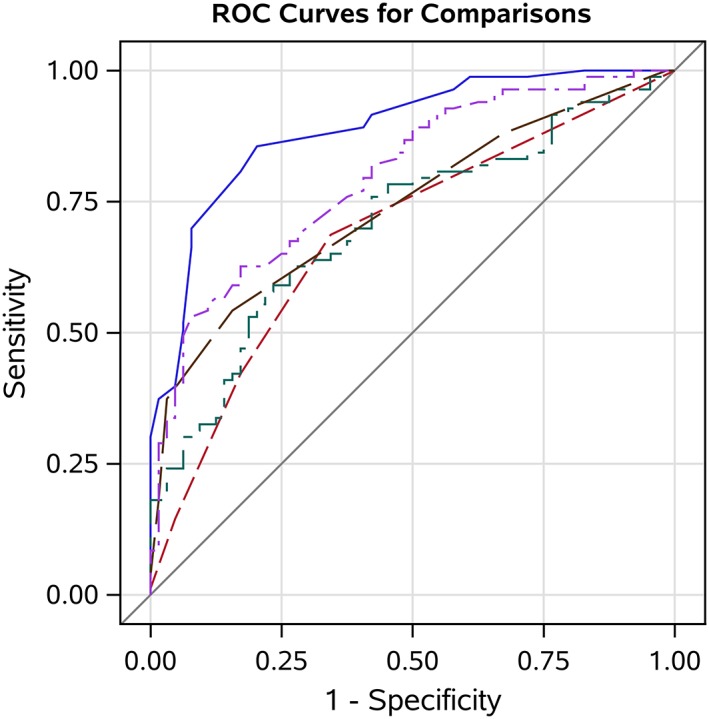
Figure 7.

Receiver operating characteristic (ROC) curves and the area under the curve (AUC) demonstrating the diagnostic ability of urine specific gravity measured by optical refractometry (USG‐R, blue solid line; AUC = 0.90), urine electrical conductivity (UEC, purple 2‐dashed line; AUC = 0.82), urine creatinine concentration (UCreat, green dash‐dot line; AUC = 0.76), urine color (UColor, brown long‐dashed line; AUC = 0.74), and urine specific gravity measured by Multistix‐SG urine dipstick (USG‐D, red short‐dashed line; AUC = 0.63) to detect hypohydration (≥800 mOsm/kg) in dairy cattle. The diagonal line represents the ROC curve for a test of no predictive ability. The optimal cut points for detecting hypohydration were ≥1.030, ≥23.7 mS/cm, ≥4, ≥95.3 mg/dL, and ≥1.015, for the USG‐R, UEC, UColor, UCreat, and USG‐D, respectively
