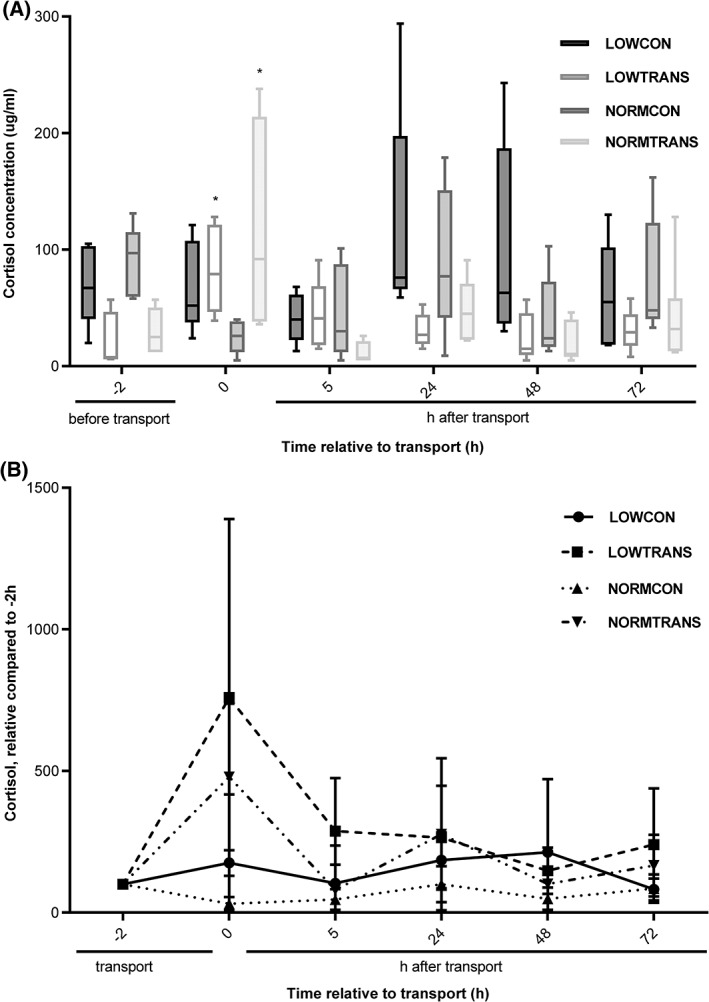
Figure 1.

Serum cortisol concentration in underweight and normal weight dairy calves, exposed to short transport or no transport in (A) LOWCON (low body weight, no transport [n = 5]), LOWTRANS (low body weight, transport [n = 5]), NORMCON (normal body weight, no transport [n = 5]), and NORMTRANS (low body weight, transport [n = 6]) calves. Values are measured at time points before and after transport. And (B) the relative serum cortisol concentration changes in the 4 groups of calves related to the initial serum cortisol concentration at time point −2 hours (before transport); data are shown in mean ± SD; * represents a significant (P < .05) effect between groups
