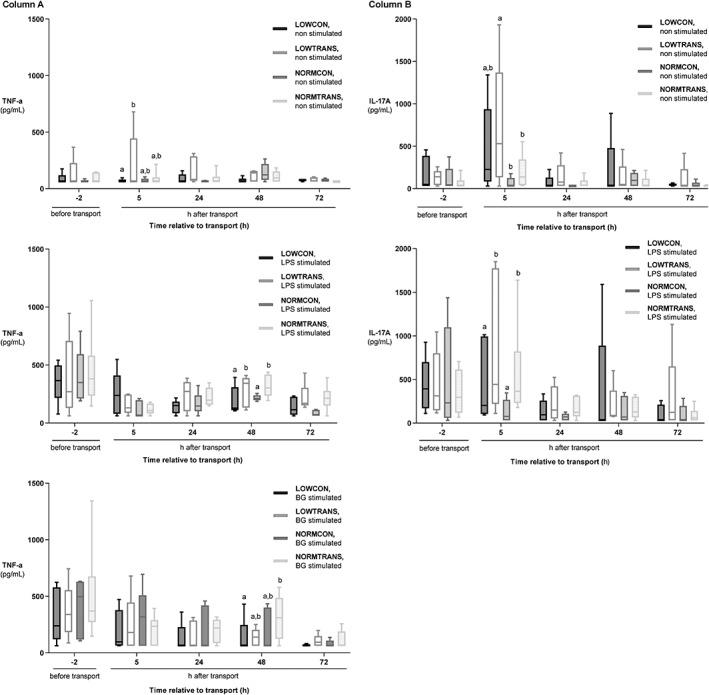
Figure 4.

Cytokine production in low body weight and normal body weight dairy calves after short transport of 2 hours or no transport. Groups were as followed: LOWCON (low body weight, no transport [n = 5]), LOWTRANS (low body weight, transport [n = 5]), NORMCON (normal body weight, no transport [n = 5]), and NORMTRANS (low body weight, transport [n = 6]). Column (A) shows the cytokine production of peripheral blood mononuclear cells (PBMC) from the 4 examined groups of calves in unstimulated (blanco), lipopolysaccharide (LPS), and beta‐glucan (BG)–stimulated cells. Column (B) depicts the cytokine production of PBMCs of the same groups of calves in unstimulated and in LPS‐stimulated cells. Results are expressed as mean ± SD. Items with different letters are statistically different (P < .05)
