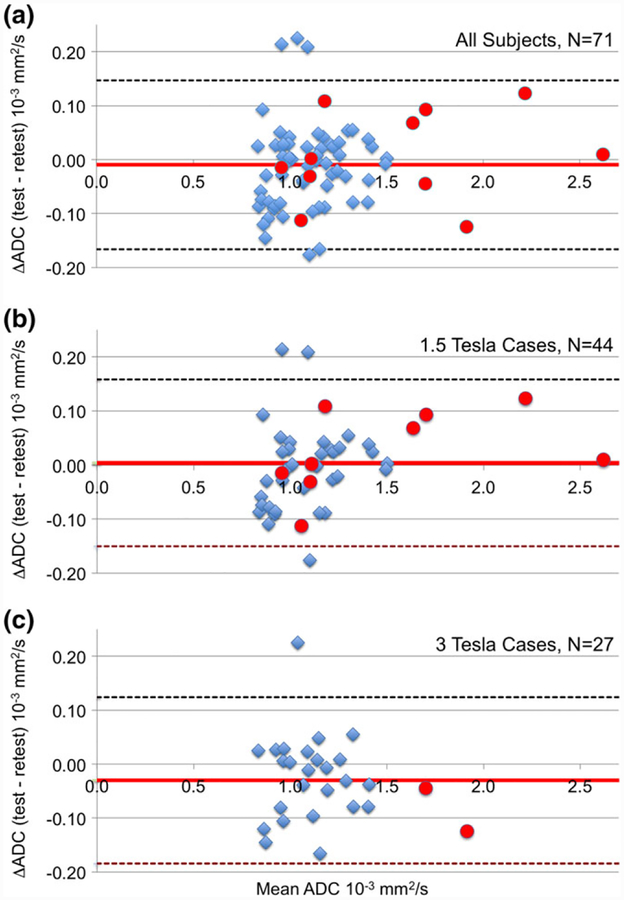
FIGURE 3:
Bland-Altman plots for the difference in whole-tumor ADC measurements between test and retest for: (a) entire analyzable cohort, (b) 1.5T cases, and (c) 3T cases. Blue diamonds indicate the 60 measurements taken at timepoint T0 (pretreatment) and red circles indicate the 11 measurements taken at timepoint T1 (early treatment). Mean difference and 95% CI (1.96 * SD) are shown as horizontal solid red and dashed black lines, respectively. No trend was seen in the ADC difference with ADC magnitude.

