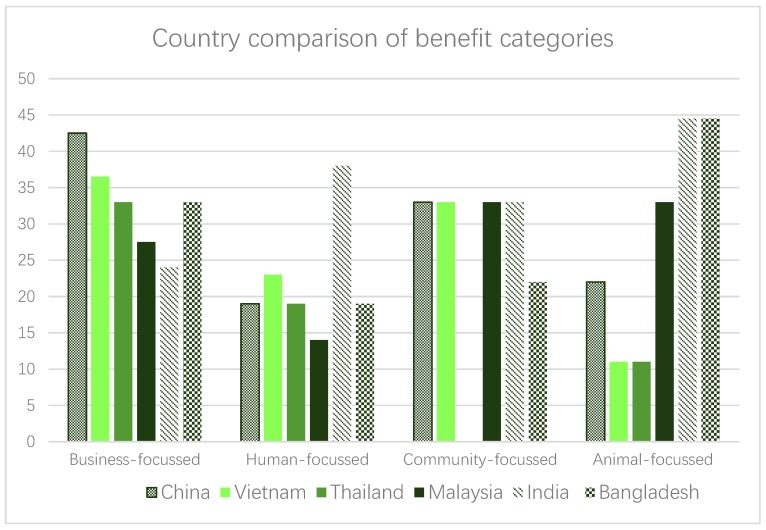
Figure 2.
Comparison between countries of benefit categories, based on frequency of appearance. Note: Amount of times a benefit falling under this category appeared, presented in a percentage according to the amount of opportunities to raise it as a benefit per country. Individual benefits associated to categories as per the colour key in Table 1.

