Fig. 4.

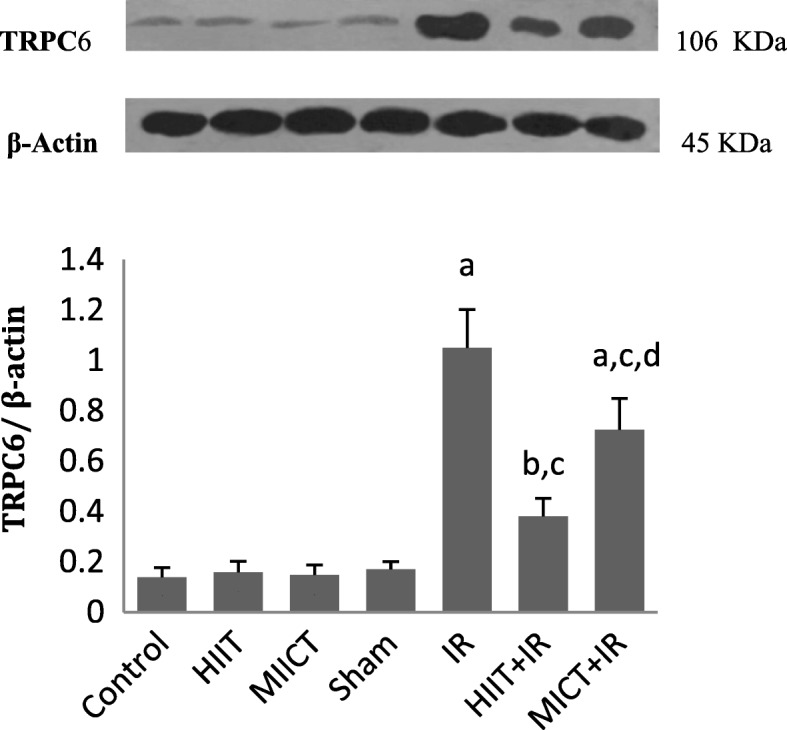
Ratio of TRPC6 to β-actin expression in experimental groups (n = 4). a P < 0.001 and b P < 0.05 vs Sham, c P < 0.001 vs IR, and d P < 0.001 vs HIIT+IR group

Ratio of TRPC6 to β-actin expression in experimental groups (n = 4). a P < 0.001 and b P < 0.05 vs Sham, c P < 0.001 vs IR, and d P < 0.001 vs HIIT+IR group