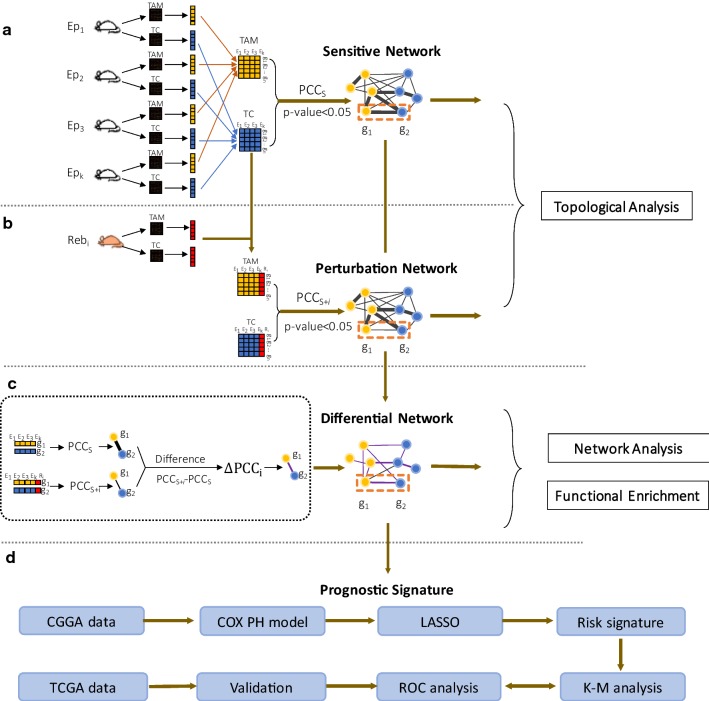
Fig. 1.
Schematic illustration of the multicellular gene network-based identification of risk signatures. a The correlation (e.g., PCCs) of each pair of differential genes in TAMs and TCs of the Endpoint samples were computed to construct a sensitive multicellular network. b Each single Rebound sample was added to the Endpoint samples to construct a sample-specific resistance multicellular network (Additional file 1: Fig S2–S6). c A robust differential network was constructed using the differences between correlation coefficients of gene pairs in the sensitive and perturbation networks. Topological analysis, signature gene analysis and gene enrichment analysis were used to analyze the networks. d Based on the differential network, we used the COX PH model and LASSO method to select prognostic genes and define a risk signature. The clinical information and RNA-seq expression data in the CGGA and TCGA databases were used as learning and validation sets, respectively

