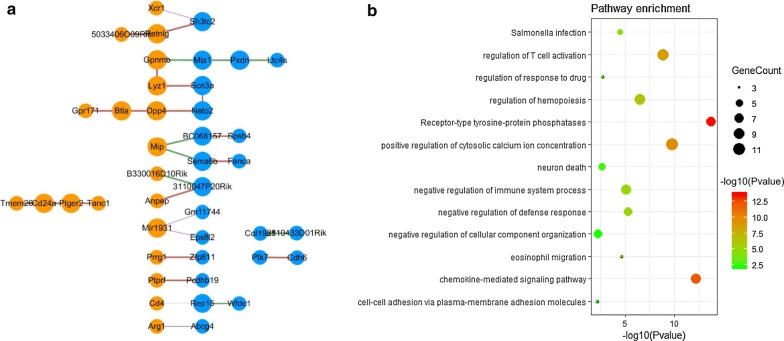
Fig. 2.
Differential network between drug-sensitive and drug-resistant multicellular gene networks and functional enrichment analysis. a A robust differential gene association network underlying glioma resistance to CSF1R inhibition. The node label represents the gene name. The size of the node represents its connectivity. The orange and blue nodes represent the genes in TAMs and TCs, respectively. b Pathway enrichment of the genes in the differential network

