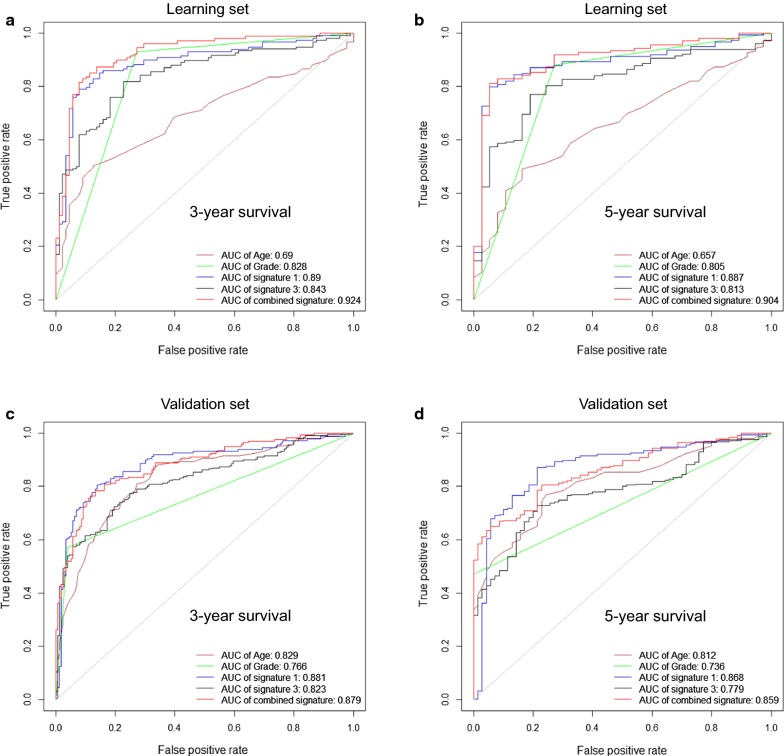
Fig. 9.
Time-dependent ROC curves comparing the prognostic accuracy of the macrophage-related gene signature with clinicopathological risk factors and other existing gene signatures or their combination. a, b Comparisons of the prognostic accuracy by age, grade (low grade or high grade), signature 1 (i.e., macrophage-related gene signature), signature 3 (i.e., Cheng et al. signature) and the combined signature using the learning set with respect to 3-year survival (a) or 5-year survival (b). c, d Comparisons of the prognostic accuracies with respect to 3-year survival (c) or 5-year survival (d) using the validation set

