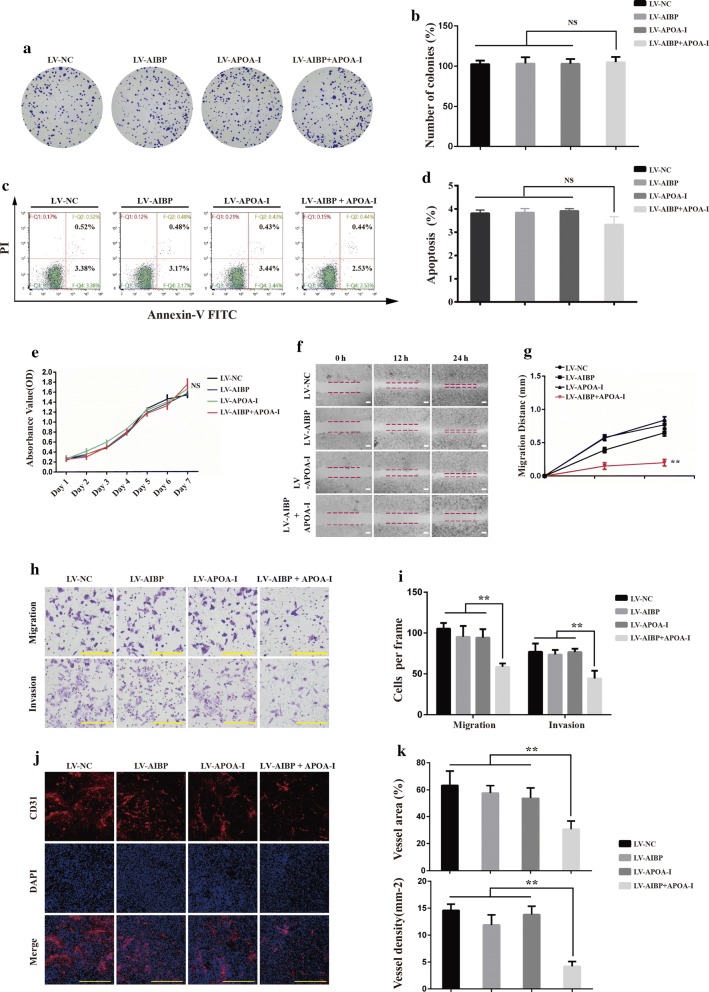
Fig. 4.
The effect of combined AIBP and APOA-I on colon cancer cells’ biological behavior. a, b Representative images and statistical analyses of clone formation (mean ± SD, n = 3, NS, no significant difference). c, d Analysis of cell apoptosis by flow cytometry. e The CCK-8 assay for viability of the indicated cells from day 1 to day 7 (mean ± SD, n = 3, NS, no significant difference). f Wound healing assay for migration of the indicated cells. Representative images were taken at the indicated time points. Scale bar, 200 μm. g The corresponding migratory distance was quantified (n = 3; *P < 0.05; **P < 0.01). h Representative fields of the indicated cells passing through the transwell chambers; Scale bar, 100 μm. i The number of cells per frame was counted. j CD31 staining for tumor-induced angiogenesis. Scale bar, 100 μm. k Vessel density (mm2) and vessel area (%; mean ± SD, n = 5; **P < 0.01)

