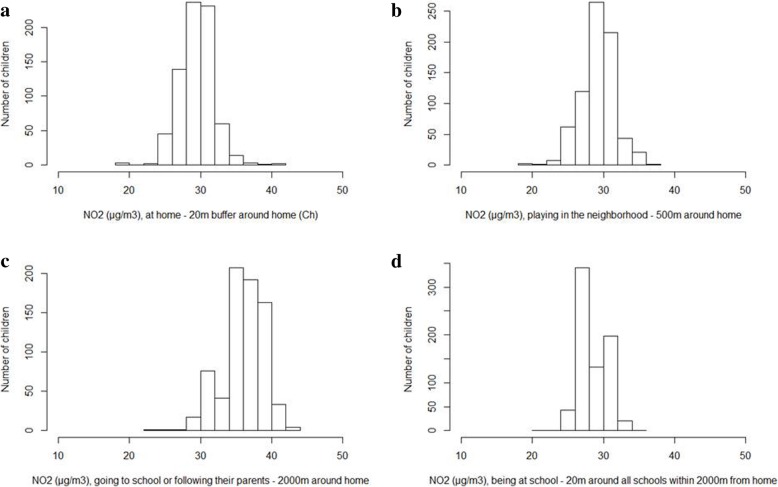
Fig. 3.
NO2 distributions during children’s primary activities. a, NO2 at home – 20 m buffer around home location (Ch); b, NO2 playing in the neighbourhood – 500 m around home location (Cp); c, NO2 going at school or following parents – 2000 m around home location (Ct); d, NO2 being at school – 20 m around all schools within 2000 m around home (Cs)

