
Fig. 6.
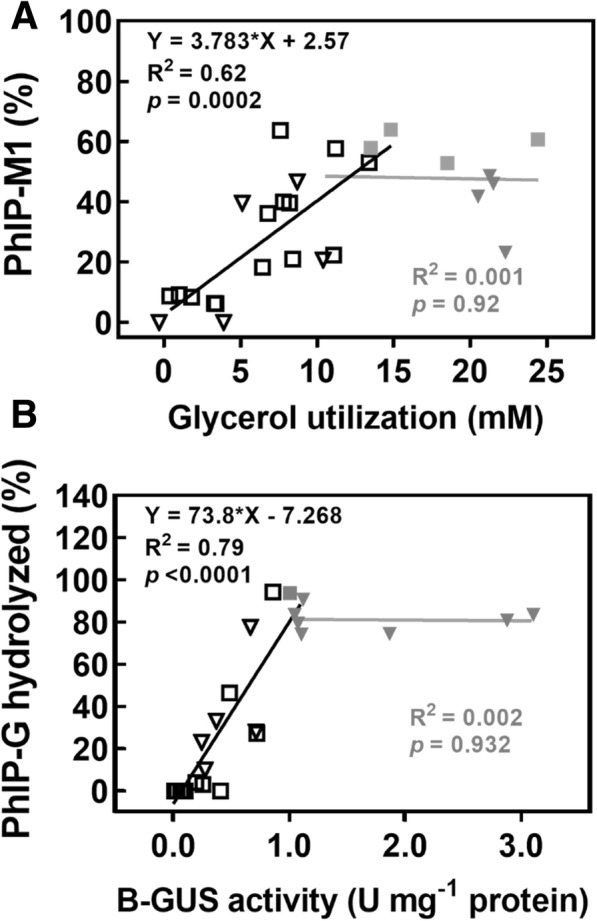
Correlation of glycerol utilization and B-GUS activity with relative PhIP-M1 formation and PhIP-G hydrolysis. a correlation of glycerol utilization and PhIP-M1 formation. The proportion of PhIP-M1 was calculated as the ratio of PhIP-M1 relative to the total amount of PhIP and PhIP-M1, b correlation of B-GUS activity (determined using PNP-G) and PhIP-G hydrolysis. Data were combined from single cultures (filled and open square) and co-cultures (filled and open triangle). Grey and black symbols in (a) represent glycerol utilization above and below 14 mM, respectively. Grey and black symbols in (b) represent B-GUS activity above and below 1.0 U/mg protein, respectively