Fig. 4.
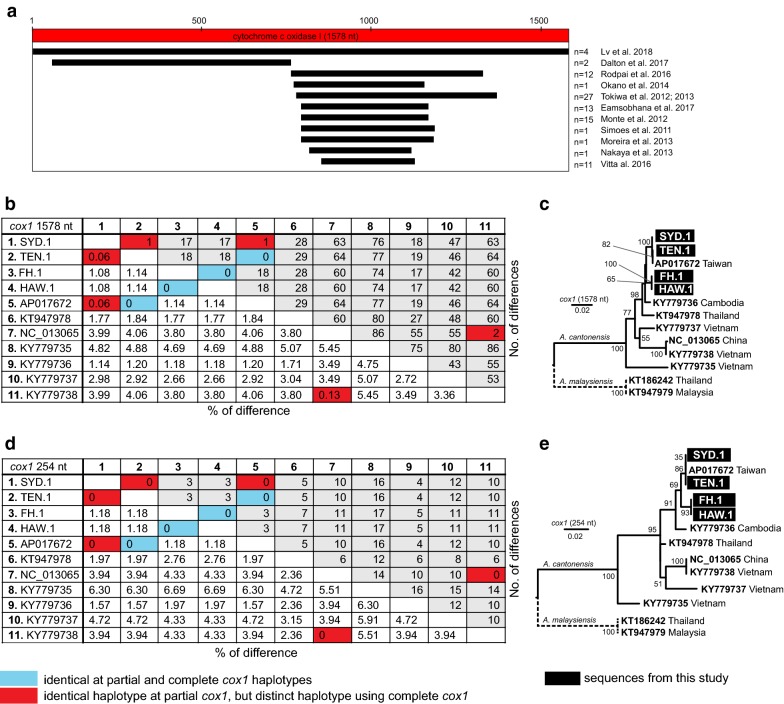
Comparison of Angiostrongylus cantonensis diversity at cox1 sequences. Map of cox1 regions amplified by different authors relative to the complete cox1 (a). Pairwise sequence distance expressed as percentage of difference and number of differences for complete cox1 (b). The alignment of complete cox1 included 1,433 (90.1%) conserved, 145 (9.2%) variable and 75 (4.8%) parsimony informative sites and 70 (4.4%) singletons. Maximum likelihood tree reconstructed using the TN93 model [60] from this alignment (c). Pairwise sequence distance expressed as percentage of difference and number of differences for 254-bp region of cox1, where the majority of available sequences overlap (d). Alignment of the 254-bp region included 227 (89.4%) conserved, 27 (10.6%) variable and 13 (5.1%) parsimony informative sites and 14 (5.5%) singletons. Maximum likelihood tree reconstructed using the TN93 model [60] from this alignment (e). In both trees, bootstrap values above 50 are shown

