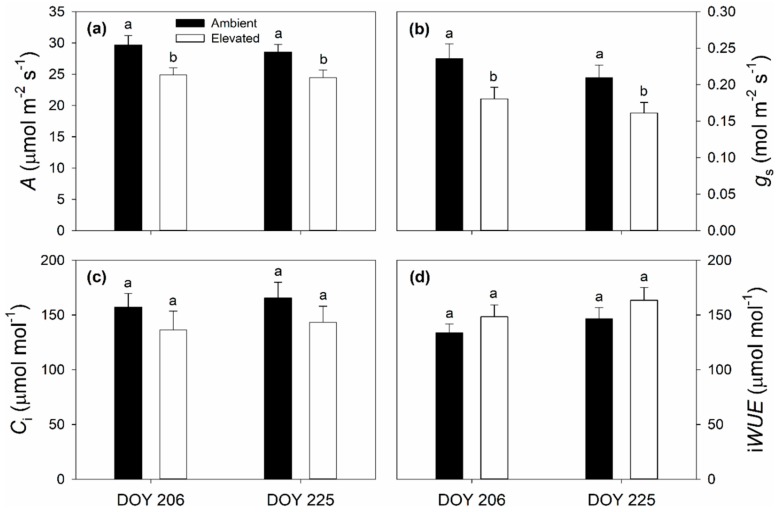
Figure 1.
Average values of: net CO2 assimilation rate (A) (a); stomatal conductance (gs) (b); intercellular CO2 concentration (Ci) (c); and instantaneous water use efficiency (iWUE) (d) of ambient and elevated O3 concentration treated switchgrass leaf measured on 25 July (DOY 206) and 13 August (DOY 225) in 2018. Error bars show standard errors (n = 3). Significant differences between ambient and elevated O3 are indicated by different letters.

