
Figure 3.
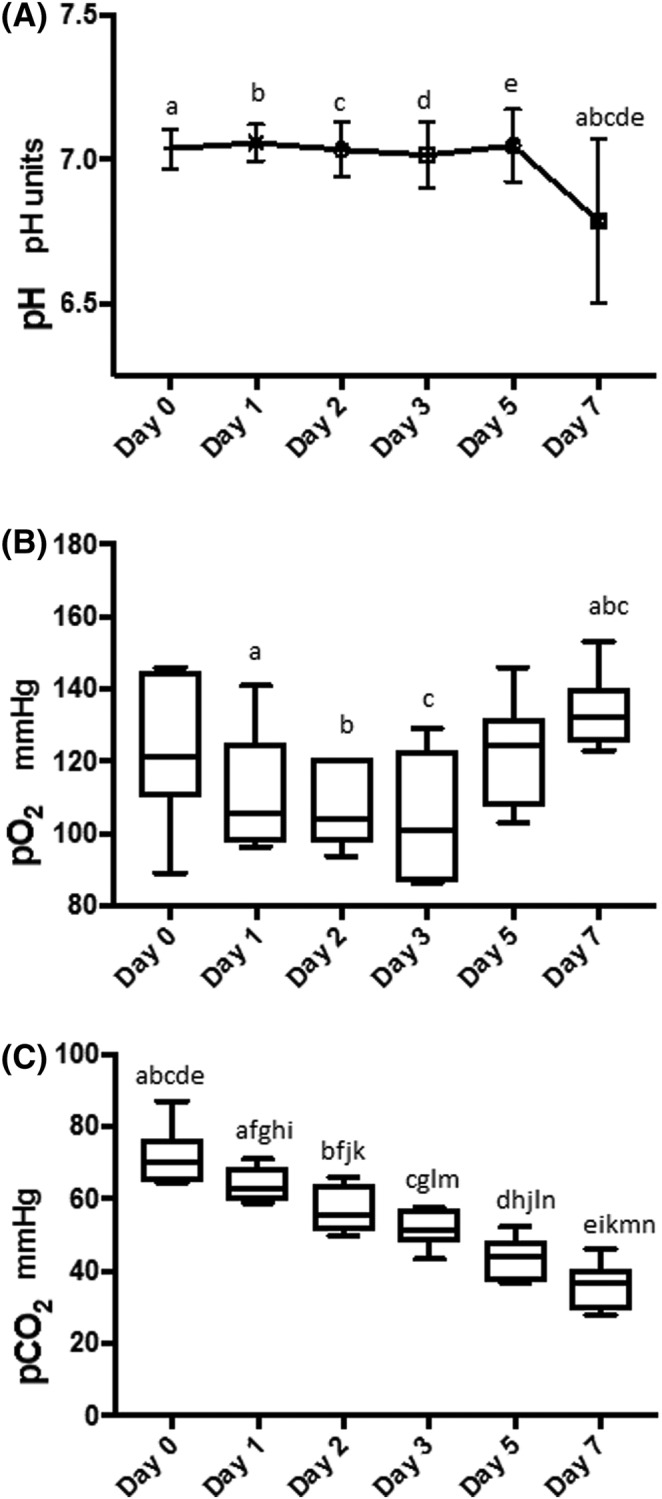
Graph illustrating pH (A), and box plots illustrating the partial pressures of oxygen (pO2) (B) and carbon dioxide (pCO2) (C) in the platelet concentrate during each day of storage. A, There was a statistically significant decrease in pH on day 7 compared to each of the other days. acd P < .01, be P < .001. B, There was significant variation of pO2 over the study period ending with a significant increase on day 7. a P < .05, bc P < .01. C, Partial pressures of carbon dioxide decreased significantly over time with the most marked decrease between days 0 and 7. afn P < .05, bcdeghijkm P < .001, l P < .001