FIGURE 3.

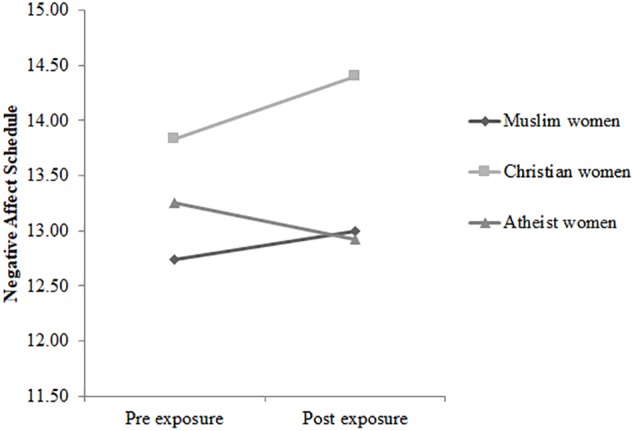
The time course of scores on the Negative Affect Schedule for veiled Muslim women (n = 34), Christian women (n = 48), and atheist women (n = 36) in the experimental condition.

The time course of scores on the Negative Affect Schedule for veiled Muslim women (n = 34), Christian women (n = 48), and atheist women (n = 36) in the experimental condition.