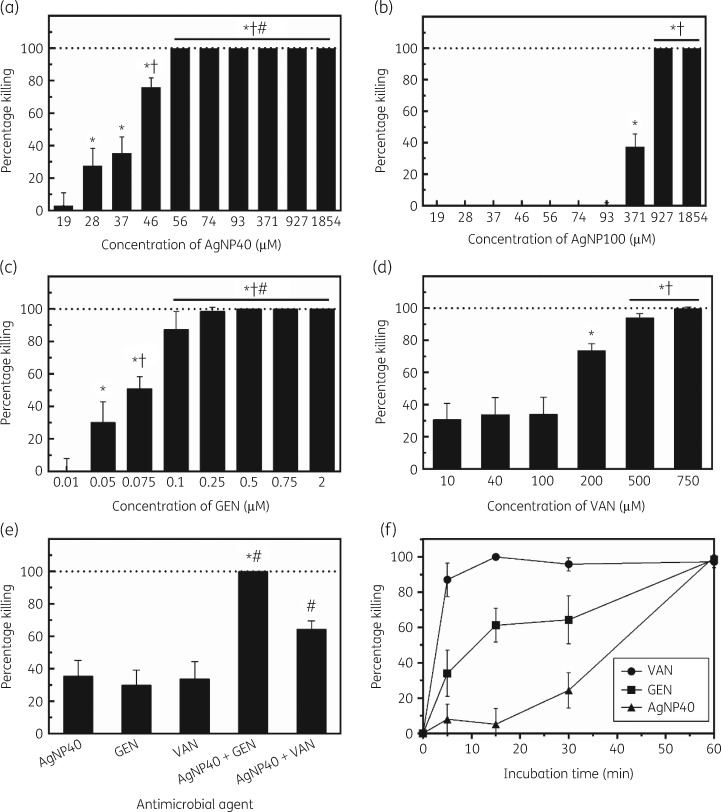
Figure 2.
Extracellular bacterial killing efficacy and kinetics of AgNPs, gentamicin and vancomycin. (a) 40 nm AgNP treatment for 1 h at 37°C (*P < 0.0001 compared with 19 μM, †P < 0.0001 compared with 28 and 37 μM, #P = 0.0001 compared with 46 μM). (b) 100 nm AgNP treatment for 1 h at 37°C (*P < 0.0001 compared with 93 μM, †P < 0.0001 compared with 371 μM). (c) Gentamicin treatment for 1 h at 37°C (*P < 0.0001 compared with 0.01 μM, †P < 0.001 compared with 0.05 μM, #P < 0.0001 compared with 0.075 μM). (d) Vancomycin treatment (*P < 0.0001 compared with 10, 40 and 100 μM, †P < 0.001 compared with 200 μM). (e) Combination treatments for 1 h at 37°C (*P < 0.0001 compared with AgNPs and gentamicin, #P < 0.0001 compared with AgNPs and vancomycin). (f) Kinetic profiles at 37°C. AgNP40, 40 nm AgNPs; AgNP100, 100 nm AgNPs; GEN, gentamicin; VAN, vancomycin.

