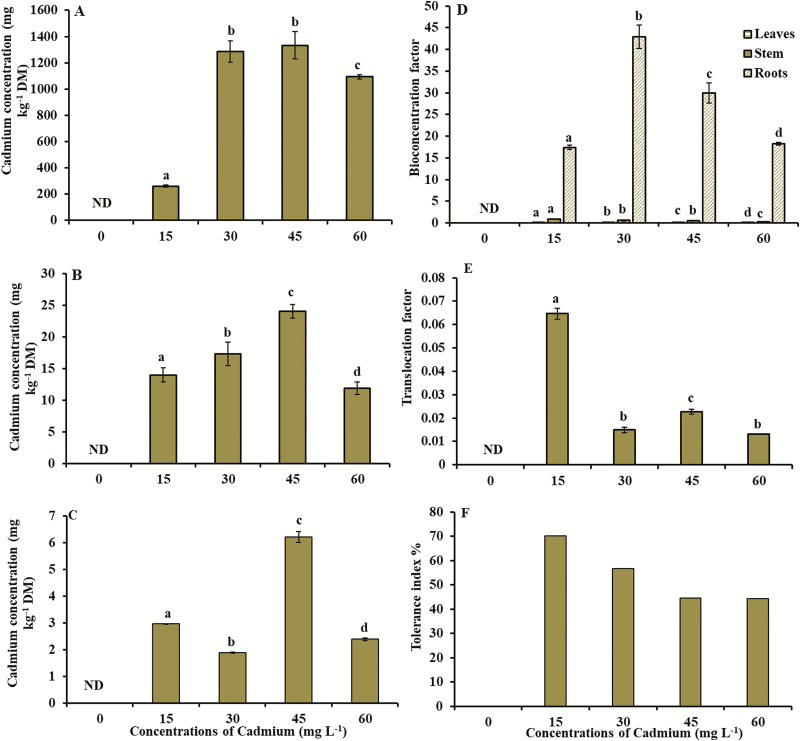
Figure 3.
(A) Cadmium concentration in the roots, (B) cadmium concentration in the stem, (C) cadmium concentration in the leaves, (D) bioconcentration factor, (E) translocation factor and (F) tolerance index in young plants of V. surinamensis exposed to five concentrations of cadmium (0, 15, 30, 45 and 60 mg). ND = not detected; DM = dry mass. Different letters for concentrations of cadmium in solution indicate significant differences in the Kruskal–Wallis test (P < 0.05). Mean ± SD, n = 7.

