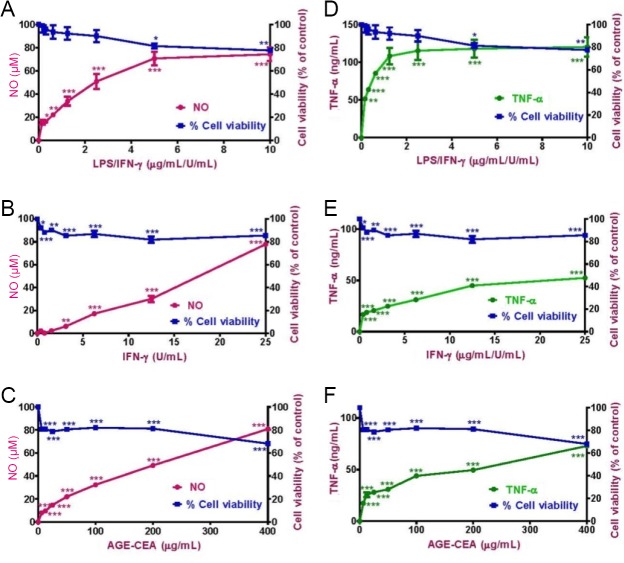
Figure 2.
Dose-response curves for (A) LPS/IFN-γ, (B) IFN-γ and (C) CEA-AGE for NO production with cell viability and (D) LPS/IFN-γ, (E) IFN-γ and (F) CEA-AGE for TNF-α production with cell viability.
RAW264.7 macrophages were activated with LPS + IFN-γ, IFN-γ or CEA-AGE in a concentration-dependent manner and measured the NO and TNF-α inhibition and cell viability after 24 hours. Results represent the mean ± SEM of two experiments in triplicate. Statistical analysis was carried out using a one-way analysis of variance followed by Dunnett’s multiple comparison tests (*P < 0.05, **P < 0.01, and ***P < 0.001, vs. non-activated cells). LPS: Lipopolysaccharide; IFN-γ: interferon-gamma; CEA-AGE: chicken egg albumin-derived advanced glycation end product; NO: nitric oxide; TNF: tumor necrosis factor.

