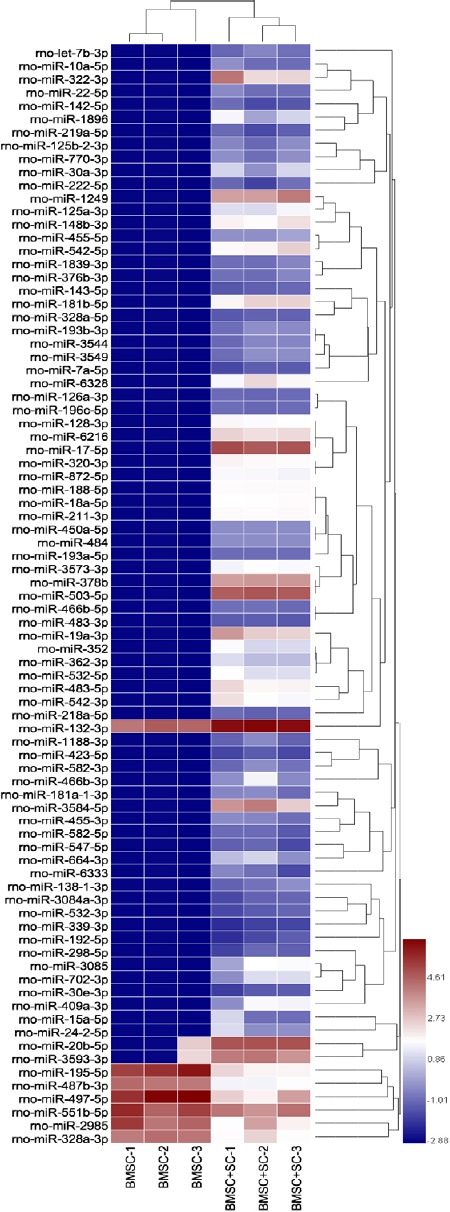
Figure 2.

Heat map of miRNA expression levels in BMSCs.
miRNA microarray results from three replicates of two groups: BMSCs induced with SC-conditioned medium and BMSCs cultured in unconditioned medium. miRNA microarray results shown used hierarchal clustering of differentially expressed miRNA under the condition “P < 0.05 and fold change > 2.0”. The rightmost legend represents fold-change. BMSCs: Bone marrow-derived mesenchymal stem cells; SC: Schwann cells.
