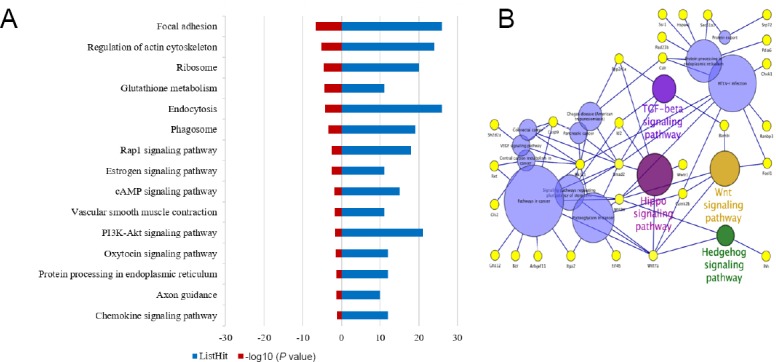
Figure 4.

Pathway analysis of differentially expressed miRNA targets.
(A) KEGG pathway analysis results. Blue column shows the number of genes, while red column shows the P value (–log10). (B) Result generated by Cytoscape software 3.5.1. Circles representing TGF-beta, Hippo, Wnt, and Hedgehog signaling pathways are related to stem cell differentiation, while circles with different colors and the remaining yellow circles are not related. KEGG: Kyoto Encyclopedia of Genes and Genomes; TGF: transforming growth factor.
