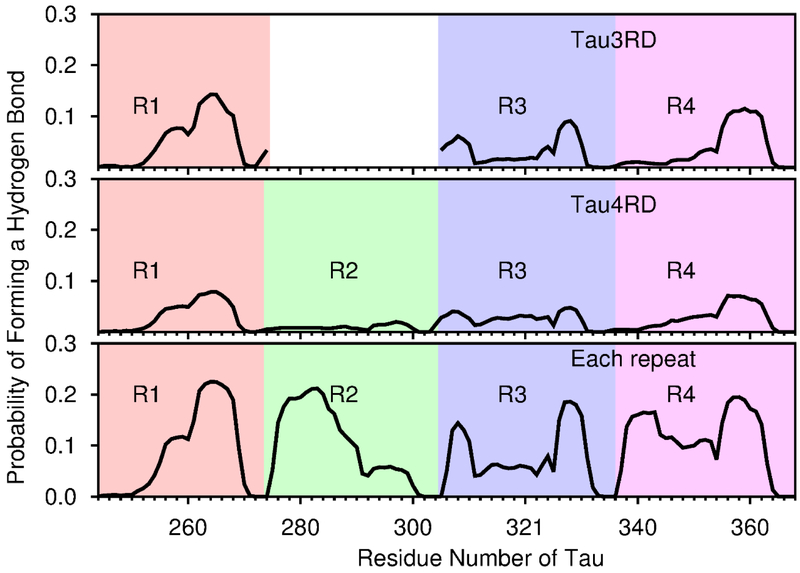
Figure 6.
The probability for each residue in Tau3RD (top), Tau4RD (middle), or any of the repeats independently (bottom), of forming a hydrogen bond with any of the residues from the Aβ chains. The results from simulations of each of the repeats independently are shown next to each other to facilitate comparison with the upper panels. The regions corresponding to each of the repeats is indicated by different background colors, pink (R1), green (R2), blue (R3) and purple (R4). Numbering of residues corresponds to the longest Tau isoform, with R1=244-274, R2=275-305, R3=306-336 and R3=337-368. For top plot (Tau3RD), the region corresponding to the second repeat is empty because this region does not exist in Tau3RD.

