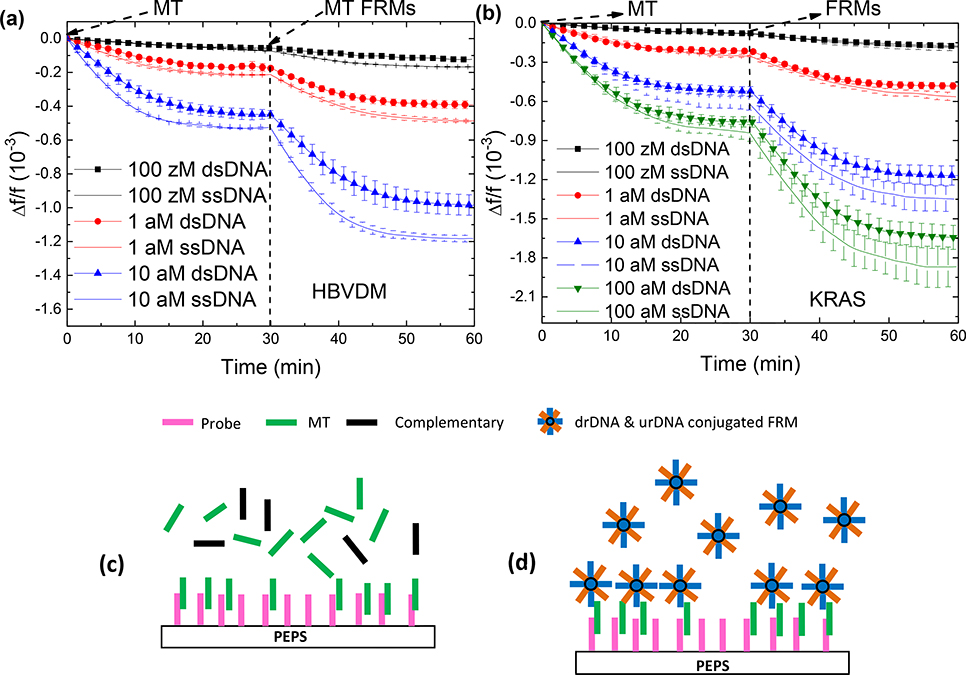
Figure 3.
Δf/f versus time of dsMT detection and the following FRMs detection at various concentrations of MT for (a) HBVDM and (b) KRAS. Also shown in (a) and (b) are the results of ssMT detections at the same concentrations as for comparison. (c) A schematic representation of dsMT detection, and (d) that of FRMs detection following the MT detection.

