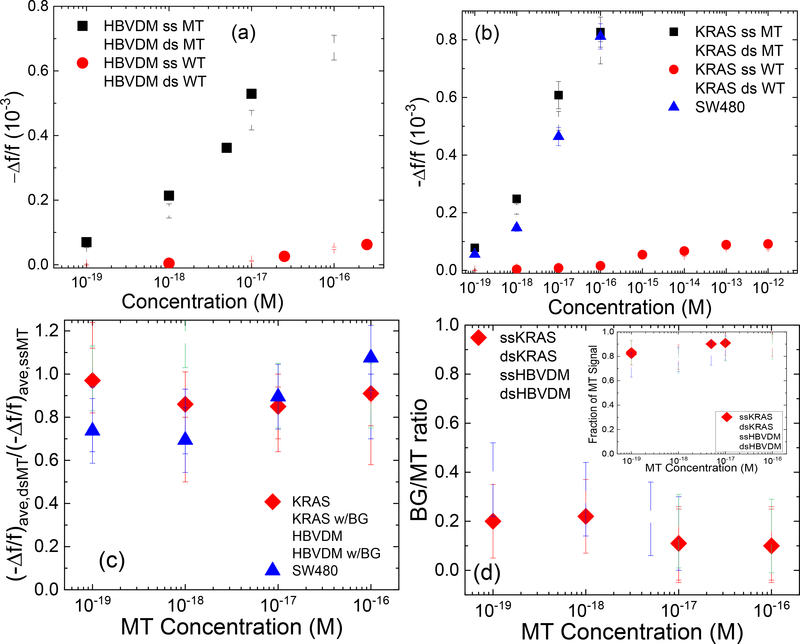
Figure. 4:
(-Δf/f)ave of dsMT detection (open squares), ssMT detection (full squares), dsWT detection (open circles), and ssWT detection (full circles) at various concentrations for (a) HBVDM and (b) KRAS; (c) (-Δf/f)ave,dsMT/(-Δf/f)ave,ssMT versus MT concentration with full diamonds for KRAS and open triangles for HBVDM; (d) (-Δf/f)ave,BG/(-Δf/f)ave,MT versus MT concentration where “BG” in the subscript denotes dsWT detection at a “BG” concentration, which was 250-fold that of MT for HBVDM and 1000-fold that of MT for KRAS, respectively. The insert in (d) shows estimated fraction of MT signal versus MT concentration where the estimated fraction of MT signal is defined as (-Δf/f)ave,MT/[(-Δf/f)ave,MT+(-Δf/f)ave,BG] with (Δf/f)ave,BG being the (-Δf/f)ave of WT at the BG concentration and (-Δf/f)ave being the average - Δf/f of t = 25–30 min. Also shown in (c) are the detection results ds HBVDM with 250-fold WT (open down triangles) and ds KRAS with 1000-fold WT (open circles) as well as that of DNA fragments from SW480 cells (full up triangles).

