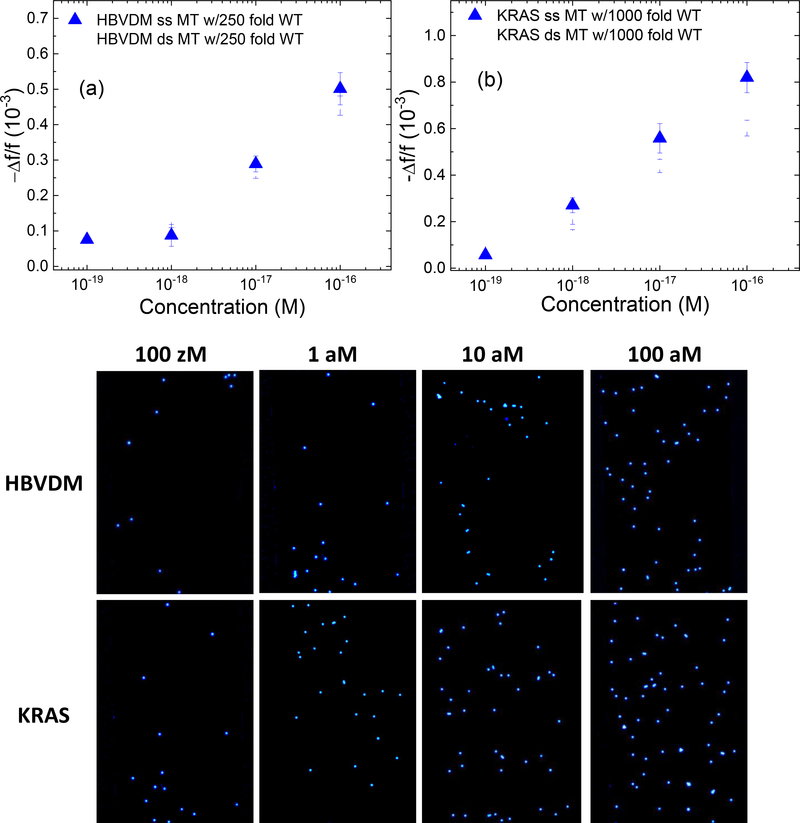
Figure 5:
Average -Δf/f at 25–30 minutes versus concentration of dsMT detection for (a) HBVDM in a background of 250-fold dsWT and that for (b) KRAS in a background of 1000-fold dsWT, which was followed by detection in a mixture of 105 FRMs/ml of FRMs in PBS. (c), (d), (e), and (f) are the fluorescent images of the PEPS obtained after the FRMs detection following the HBVDM MT detections at 0.1 aM (100 zM), 1 aM, 10 aM, and 100 aM MT concentrations, respectively and (g), (h), (i) and (j) are the fluorescent images of the PEPS obtained after the FRMS detection following the KRAS MT detections at 0.1 aM (100 zM), 1 aM, 10 aM, and 100 aM MT concentrations, respectively.

