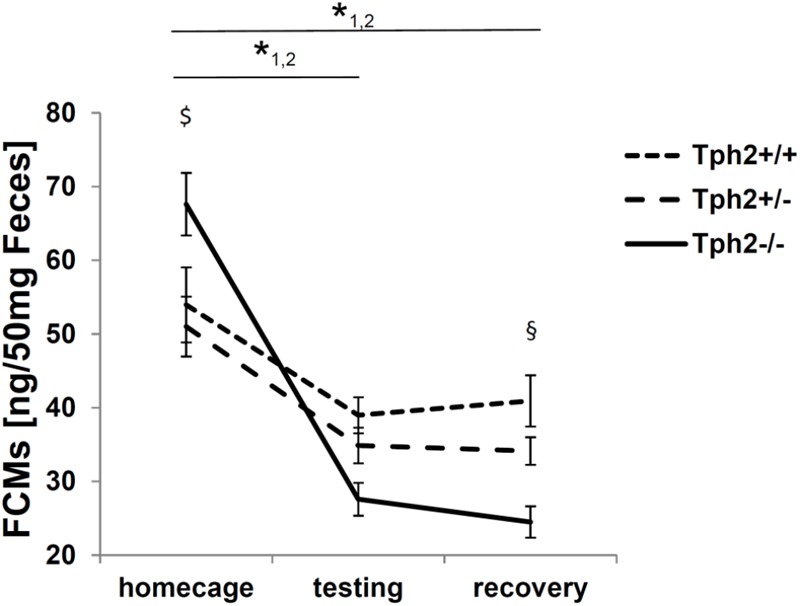
FIGURE 2.

Fecal corticosterone metabolites (FCMs) in 50 mg feces. 1 p < 0.05 for home cage compared to testing and recovery in tryptophan hydroxylase 2 (TPH2)-deficient mice (Tph2-/-). 2 p < 0.05 for home cage compared to testing and recovery in Tph2+/-. $ p < 0.05 Tph2-/- compared to Tph2+/- under home cage conditions. § p < 0.05 Tph2-/- compared to Tph2+/+ after recovery. Data points represent group means ± standard error (n/group = 8–12). Statistical analysis was performed using repeated measures ANOVA followed by Bonferroni corrected t-test.
