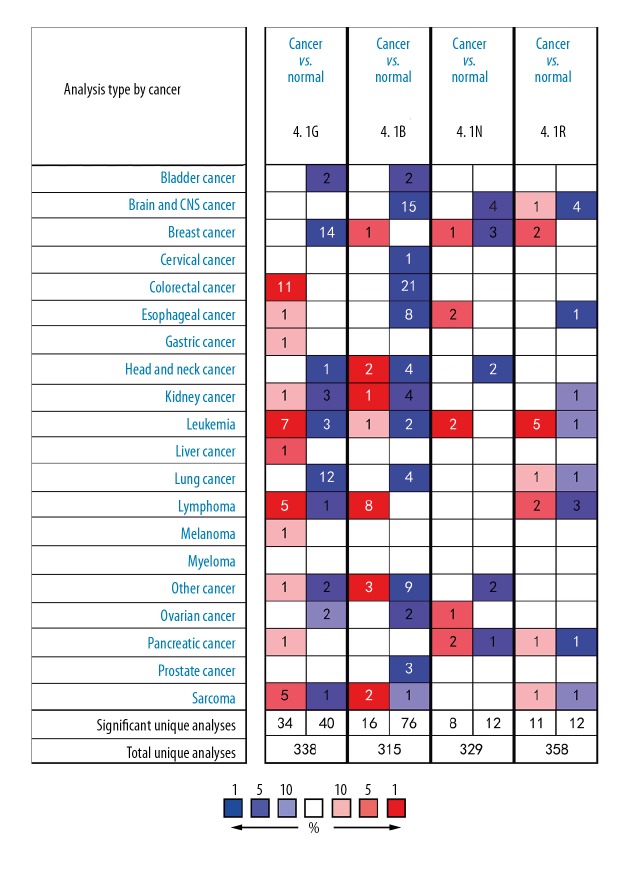
Figure 1.
The mRNA expression of 4.1 family members in overall cancers. The figure shows the numbers of datasets with statistically significant mRNA overexpression (red) or underexpression (blue) of the target gene (cancer vs. normal tissue) with thresholds as follows: p value: 0.05; fold change: 2; gene rank: 10%; data type: mRNA. The number in the colored cell represents the number of analyses meeting these thresholds. Cell color is determined by the best gene rank percentile for the analyses within the cell.

