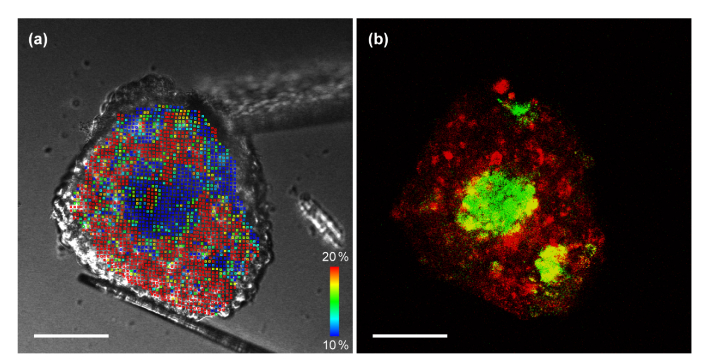
Fig. 4.
Analysis of tumor-fibroblast co-culture spheroid. HDFa cells were added to the T47D spheroid at day 7 of incubation, allowing for fibroblast infiltration, and imaged at day 11. (a) Von Mises strain calculated from DIC images. (b) Overlay fluorescence image of tracking dyes used to identify cell types (T47D: red, HDFa: green). Three distinctive regions of fibroblast cells are visible in both images. The strain analysis indicates that fibroblast regions are stiffer than cancer cells. Scale bars = 100 µm. A movie clip (Visualization 3 (488.4KB, mp4) ) is available.

