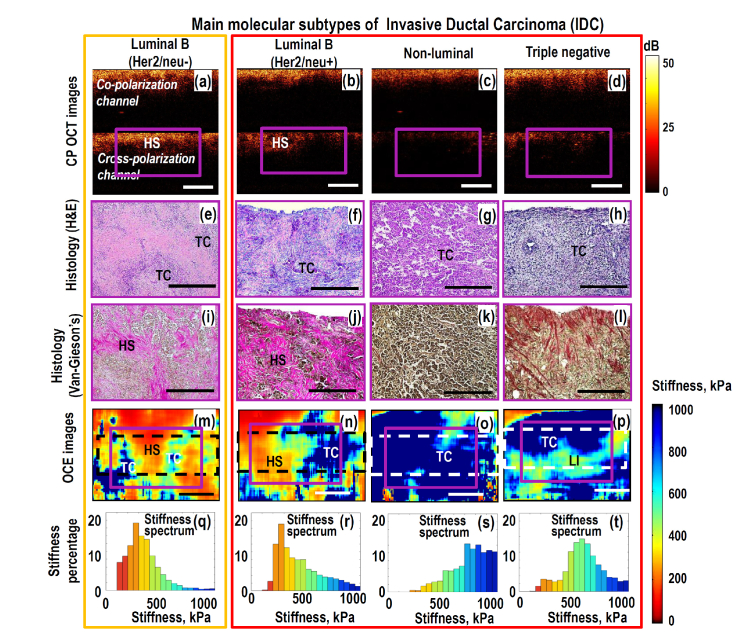
Fig. 3.
Left-to-write columns present comparative OCT-based and histological results for main molecular subtypes of IDC: low grade Luminal B (Her2/neo-) with fairly good treatment prognosis (orange box) and high grade invasive tumors with poor prognosis (grouped in big red box): Luminal B (Her2/neo + ), non-luminal and triple-negative breast cancers. Magenta-color (solid line) rectangles in the CP OCT and OCE images indicate the areas covered by the respective histologic sections. The dashed-line rectangles in the OCE images indicate the tissue area over which histograms of the stiffness spectrum were calculated. Letters in the images indicated locations of agglomerates of tumor cells (TC), fibrous stroma (FS), hyalinized stroma (HS) and lymphocytic infiltrate (LI). Scale bars correspond to 0.5 mm in all panels. Unlike Fig. 1(e) the upper silicone layer is not shown in the OCE images.

