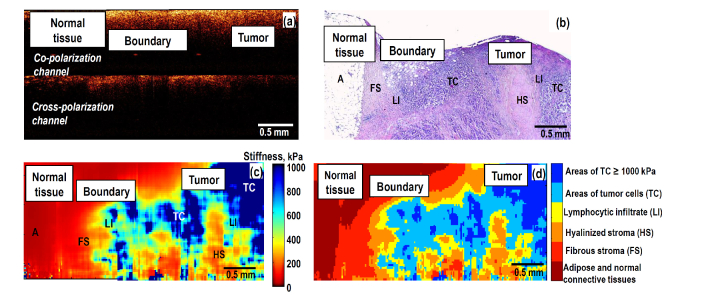
Fig. 5.
Visualization of a transitional zone between peritumoral (normal) breast tissue and tumor region using structural CP OCT, histological image and OCE-based images: (a) is the CP OCT image; (b) is the H&E-histological slice; (c) is the stiffness map through approximately the same plane (we recall that after OCE examination the sample shape was noticeably distorted during preparation of the histological slices); (d) morphological segmentation of the OCE image into areas corresponding to various tissue components, for which stiffness ranges are shown in Fig. 4.

