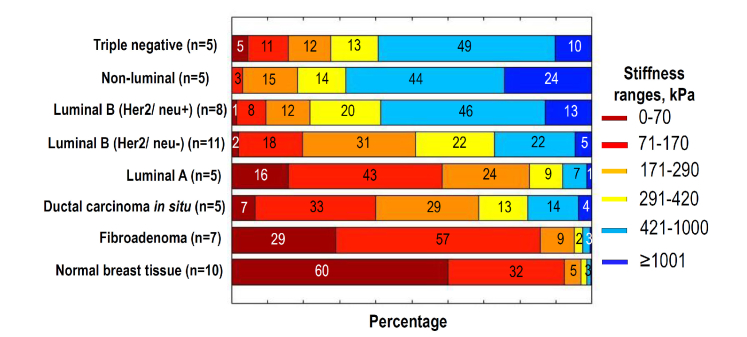
Fig. 7.
Percentage of pixels belonging to different stiffness ranges (normalized stiffness spectrum) for normal tissue, fibroadenoma, DCIS and 5 invasive breast cancer with different molecular subtypes the same as in Fig. 6 (for each group the number n of examined samples is given in the parenthes). The spectra were found for ROI shown in Figs. 2 and 3. To give a better impression about similarity/variability of elastic properties of individual specimens, “Appendix A1” demonstrates stiffness spectra for individual samples from the following 3 groups: Luminal B (Her2/neu + ), Luminal B (Her2/neu-) and fibroadenoma. Besides, “Appendix A2” presents several examples of differently chosen ROI windows for the same sample (Non-luminal cancer) to illustrate robustness of the normalized spectra to variations in the ROI position and size.

