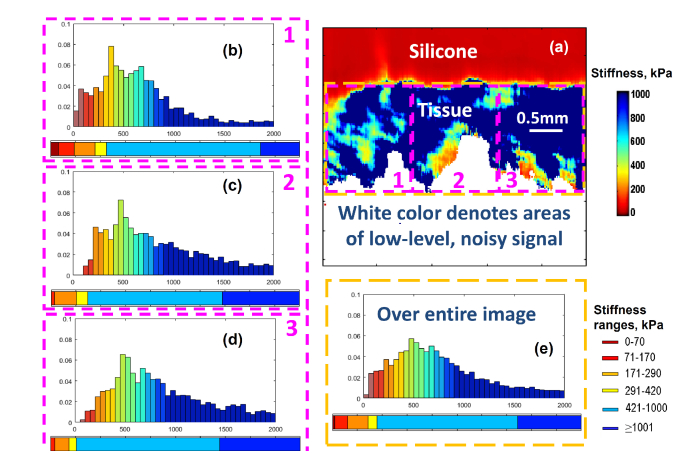
Fig. 9.
Illustration of the dependence of the calculated stiffness spectrum on the size and position of the ROI window. Panel (a) is the stiffness map for one of specimens of invasive Non-luminal cancer similar to OCE maps shown in Figs. 2 and 3, but shown together with the silicone layer. The dashed rectangles (magenta color) labeled 1,2, and 3 show the ROI zones covering 1/3 of the OCE image area. The histograms (b), (c) and (d) labeled by the corresponding numbers show the stiffness spectra for each of the 3 ROI windows. The histogram (e) is calculated for the larger ROI window shown by the yellow dashed rectangle in panel (a). The color-ribbons below the histograms are the stiffness-percentage graphs similar to those in Fig. 7 corresponding to the smaller ROI windows from 1 to 3 in panels (b), (c) and (d) and the larger ROI window over the entire OCE scan of the tissue stiffness (panel (e)).

