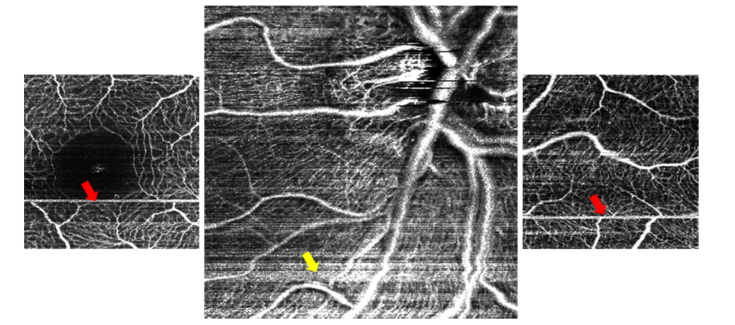
Fig. 8.
Representative OCTA images from a healthy adult volunteer. Left: ~1.5x1.5mm angiogram of the fovea showing the FAZ with well-demarcated capillaries at the margin. Center: ~3x3mm angiogram of the optic nerve head showing multiple levels of large to small vessels of the optic nerve head (upper right corner) and retina. Right: ~1.5x1.5mm angiogram of nasal retina. The red arrows denote the location of artifacts caused by saccades while the yellow arrows denote the location of artifacts caused by operator hand motion.

