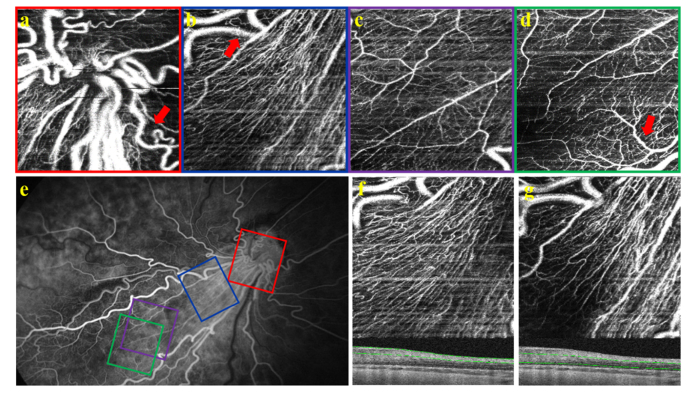
Fig. 9.
Comparison of FA to HH-OCTA during EUA from an infant with a history of ROP. HH-OCTA from a) the optic nerve (red), b) peripapillary region (blue), c) perifoveal region (purple), d) and the margin of the fovea (green). The red arrows denote examples of tortuous blood vessels. OCTA images were taken with 300 A-scans/B-scan, 4 repeated B-scans, and 300 lateral locations sampled per volume e) FA from the same infant. Colored boxes denote the location of the corresponding HH-OCTA scans. f,g) image from b) separated into superficial f) and deep g) layers. Representative B-scans with the manually corrected segmentations superimposed on the image are shown below the respective angiograms

