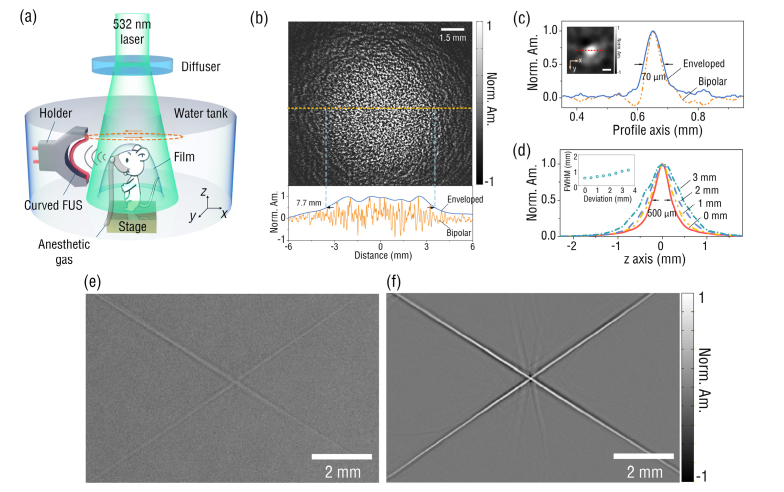
Fig. 4.
(a) Schematic of a PACT system employing a curved FUS with a curvature radius of 30 mm; (b) the PA image of a phantom prepared by mixing black-dyed microspheres into agar (up) and the PA amplitude profile along the dashed line (bottom); (c) the normalized PA amplitude profile across a single 10 μm-diameter microsphere (the scale bar is 50 μm); (d) the normalized PA amplitude profiles across a human hair along z axis at different x locations (the inset figure summarizes the elevational resolutions at different x locations); (e) and (f) are the reconstructed images of a hair-cross with a straight (left) and a curved (right) FUSs, respectively.

