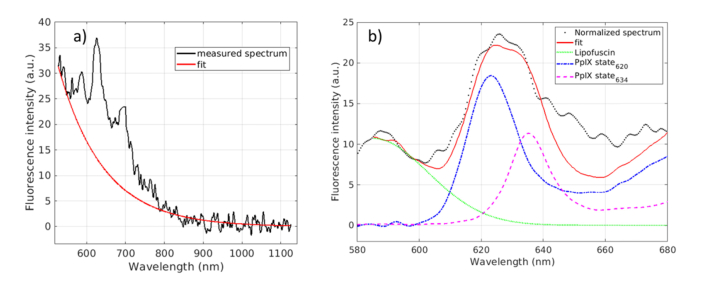
Fig. 2.
Data processing: removing of autofluorescence (a) and fit of PpIX and lipofuscin contribution (b). Experimental data (solid black line), fit (solid red curve), normalized spectrum by the autofluorescence (dotted black line), lipofuscin (solid green line), State 620 (dotted blue) and State 634 (dotted purple) measured in a low density margin of a patient aged 55 years old presenting an high grade glioma.

