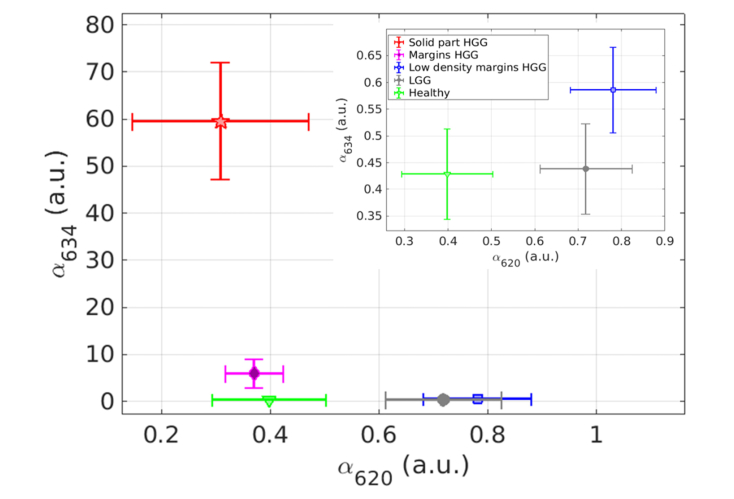
Fig. 3.
Mean and standard error of State 634 contribution versus the ones of State 620 for each class: HGG solid part (red star); HGG margins (purple diamond) HGG margins of low density (blue square), LGG (grey circle) and healthy tissues (green triangle). Insert at the top right is a zoom for the low values of state 634.

