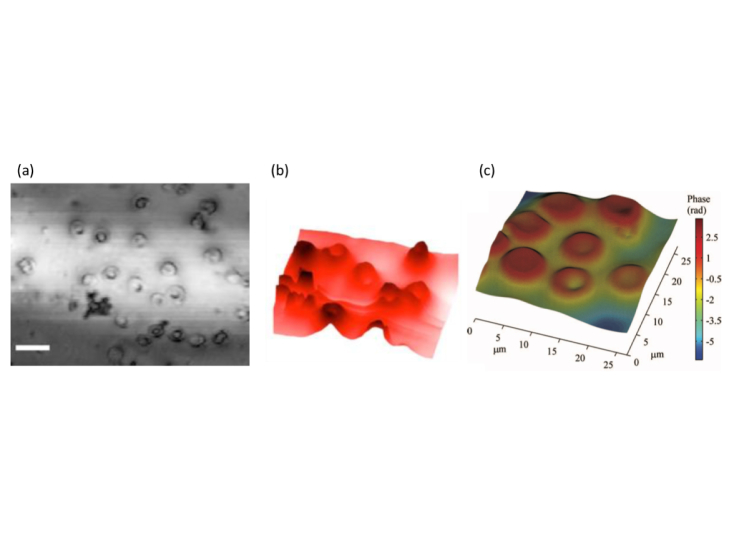
Fig. 7.
Phase contrast OCM of human erythrocytes: (a) OCT intensity image, (b) perspective quantitative phase image of the region marked with a rectangle in (a).(c) Quantitative phase image of eurythrocytes obtained with SS FF OCT(reproduced from [66] and [[67]]with permission of The Optical Society (OSA)).

