Figure 10.

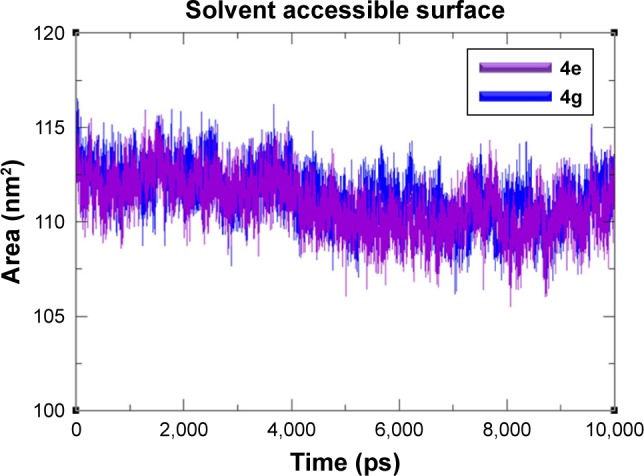
SASA graphs of 4e and 4g docked complexes are shown in purple and blue respectively from 0–10,000 ps time scale.
Abbreviation: SASA, solvent-accessible surface area.

SASA graphs of 4e and 4g docked complexes are shown in purple and blue respectively from 0–10,000 ps time scale.
Abbreviation: SASA, solvent-accessible surface area.